End Times Portfolio
End Times Portfolio
  • Understand
  • About
  • Join

prepare your family for the end times

S&P 500 Index to 400

12/10/2008

0 Comments


According to Bloomberg, CLSA Ltd. strategist Russell Napier thinks so:

"While the 39 percent drop in the S&P this year pushed equity prices below replacement cost, history suggests the ratio must sink further as deflation sets in, he said. The S&P may plunge another 55 percent to a trough of 400 by 2014, the strategist said.

"Things have always looked absolutely terrible at the bottom," said Napier, Institutional Investor’s top-ranked Asia strategist from 1997-1999. With deflation "the value of assets falls and the value of debt stays up, then equity gets crushed. The results are always horrific.""

0 Comments

Oil or gold?

12/7/2008

0 Comments


A recent issue of Agora's 5 Minute Forecast contained two useful and interesting concepts.  The first looked at the relationships between oil and gold:

"Oil and gold, two commodities that generally trade in the same direction, appear to be setting up for a historic separation. Currently, it takes 17.5 barrels of crude oil to buy one ounce of gold. The historical average for this ratio is about 15 barrels to the ounce. So… “Either oil is oversold or gold is overbought,” writes Dan Denning.

“For the ratio to return toward its historic average, oil prices would have to rise or gold prices fall. But for the short term, we reckon the ratio will increase, with the oil price falling more and the gold price holding steady or rising. There’s no law of physics that says the ratio must return to 15, but 15 is the average over time.

“Which means 2009 is going to be a strange one. Oil prices should fall to reflect a slowing world economy. Gold prices should rise to reflect the inflationary fires being stoked all over the globe.”"

Second, it discusses a recent World Gold Council report, and the record-breaking figures it cites, including:

* Dollar demand for gold in Q3 was a record $32 billion, 45% higher than the previous record (2Q 2008)

* Europe set an all-time record 1.64 million ounces of gold buying, and with France becoming a net investor for the first time since the 1980s

* Gold ETFs has record quarterly inflow of 4.8 million ounces in Q3.

0 Comments

Gold miners undervalued?

12/7/2008

1 Comment


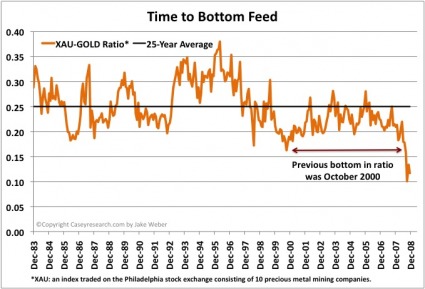
Casey Research recently posted the above image with comments paraphrased below.

The previous ratio low point of the XAU gold stock index to the price of gold was .16, when gold traded around $270 an ounce in 2000.  Today, the XAU is trading only 57% higher than in 2000, while the gold price has increased by 184%.  As a rule of thumb, a ratio above the 25-year average indicates time to sell, and below its average time to buy. With the ratio bouncing off the lowest level since the inception of the XAU index, it signals a screaming buy for gold stocks.

1 Comment

Citigroup: gold above $2,000 next year

12/3/2008

0 Comments


Not often you hear talk like this from a bank like Citigroup:

"damage caused by financial excesses ... forced world authorities to take steps never tried before.  This gamble is likely to end in one of two ways: either a resurgence of inflation; or a downward spiral into depression, civil disorder, and possibly wars. Both outcomes will cause a rush for gold."

"Gold traders are playing attention to reports that China is thinking of boosting its gold reserves from 600 tonnes to 4,000 tonnes to diversify away from paper currencies. If true, this is a very material change."


0 Comments

    About

    The End Times Portfolio helps prepare you and your family to safely survive social unrest and navigate turmoil in financial markets through sound investing that hedges against catastrophic market risk.


    Archives

    August 2011
    June 2011
    March 2009
    December 2008
    November 2008
    October 2008
    September 2008
    July 2008
    May 2008
    March 2008
    January 2008

© 2015 End Times Portfolio. All Rights Reserved. 
Understand     About     Join